In SOAP web service, each HTTP request or response encapsulates a SOAP envelope, these messages are easy to trace by using Eclipse IDE, build-in “TCP/IP monitor” tool. The idea is host another server in between the client and server to perform port forward function to intercept the HTTP traffic.
1. Normal SOAP envelope flows
In normal SOAP service, client send a HTTP request to server, and server send back a HTTP response to client directly.
1. Client ----> SOAP envelope ----> Server:9999

2. Server:9999 ----> SOAP envelope ---> Client
2. Intercepted SOAP envelope flows
To intercept SOAP envelope, you can host another server (“TcpMonitorServer”) in between client and server, see new flows :
1. Client ----> SOAP envelope ----> TcpMonitorServer:8888

2. TcpMonitorServer:8888 --> SOAP envelope ---> Server:9999

3. Server:9999 ----> SOAP envelope ---> TcpMonitorServer:8888

4. TcpMonitorServer:8888 ----> SOAP envelope ---> Client
Note
This method required port changed in your web service client.
This method required port changed in your web service client.
Eclipse IDE + TCP/IP Monitor
Eclipse IDE comes with a very easy to use traffic interceptor tool, known as “TCP/IP Monitor“. In this tutorial, we show you how to enable this “TCP/IP Monitor” in Eclipse IDE, and also intercept the SOAP messages generated by web service.
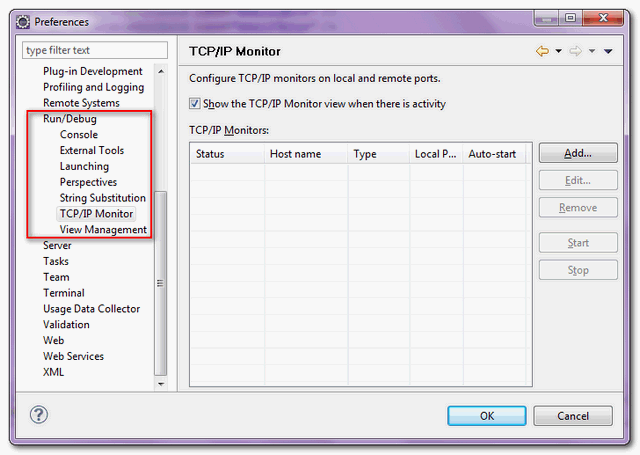
Here’s the steps to enable “TCP/IP Monitor” in Eclispe IDE.
1. In IDE, access Windows –> Preferences –> Run/Debug –> TCP/IP Monitor

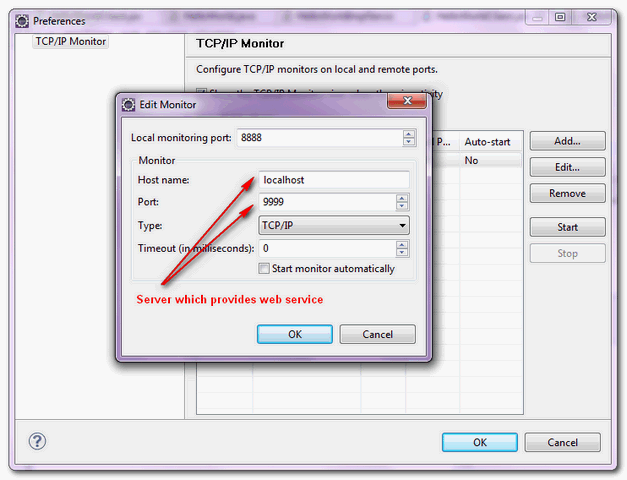
2. Fill in server information, and choose type = “TCP/IP”

3. Click on the “start” button to start tracing the web service traffic.

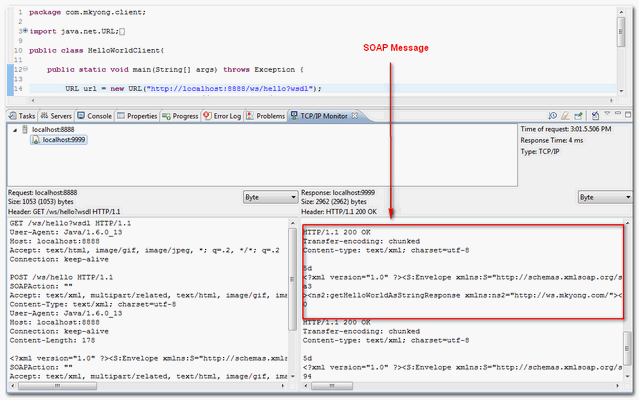
4. Show the traced messaged in the “TCP/IP Monitor” view if any.

- http://jax-ws.java.net/
- http://download.oracle.com/javaee/5/tutorial/doc/bnayn.html
- http://java.sun.com/developer/technicalArticles/WebServices/high_performance/
- http://java.sun.com/developer/technicalArticles/J2SE/jax_ws_2/
- http://blogs.sun.com/kamna/entry/using_jax_ws_handlers_to
- http://tomcat.apache.org/tomcat-6.0-doc/realm-howto.html
- http://www.ibm.com/developerworks/webservices/library/ws-docstyle.html
- http://www.oracle.com/technology/sample_code/tech/java/j2ee/jintdemo/tutorials/webservices.html
- http://www.coderanch.com/how-to/java/WebServicesFaq
- http://www.oracle.com/technetwork/articles/javase/index-137171.html
credits belong to mkyong. At least mention him
ReplyDeleteEclipse offers a built-in tool called the TCP/IP Monitor to intercept and inspect network traffic, including SOAP messages. This is a convenient way to analyze SOAP requests and responses.
DeleteBig Data Projects For Final Year Students
Steps to Trace SOAP Messages
Enable TCP/IP Monitor:
In Eclipse, go to Windows -> Preferences -> Run/Debug -> TCP/IP Monitor.
Click the Add button to create a new monitor.
Specify the Host name (usually localhost), Port (where the SOAP service is listening), and Type as TCP/IP.
Click Start to activate the monitor.
Send SOAP Request:
Make a SOAP request using your Eclipse-based client or any other SOAP client.
The request and response will be captured by the TCP/IP Monitor.
Analyze SOAP Messages:
Cloud Computing Projects Final Year Projects
python projects for final year students
The captured messages are displayed in the TCP/IP Monitor view.
You can inspect the request and response headers, as well as the SOAP envelope and body.
ReplyDeleteSome us know all relating to the compelling medium you present powerful steps on this blog and therefore strongly encourage
contribution from other ones on this subject while our own child is truly discovering a great deal.
Have fun with the remaining portion of the year.
Selenium training in bangalore
Selenium training in Chennai
Selenium training in Bangalore
Selenium training in Pune
Selenium Online training
Thank For Sharing Your Information The Information Shared Is Very Valuable Please Keep Updating Us Time Went On Just Reading The Article Python Online Course
ReplyDeleteThanks for giving great kind of information. So useful and practical for me. Thanks for your excellent blog, nice work keep it up thanks for sharing the knowledge.
ReplyDeleteSalesforce Training in Chennai
Salesforce Online Training in Chennai
Salesforce Training in Bangalore
Salesforce Training in Hyderabad
Salesforce training in ameerpet
Salesforce Training in Pune
Salesforce Online Training
Salesforce Training
hair transplant for a receding hairline
ReplyDeleteDifference Between BI and Data Science
ReplyDeleteI really like your page and happy to learn many tings from this page got much information
ReplyDeletedata science course in Hyderabad